By Charles Parat, Data Consulting Director
& Emma Damitio, Data Scientist - Solution BI Canada
ADVANCED ANALYTICS:
whatever the culture of the information's recipient,
ensure that its presentation is appropriate to its use
and that the information is relevant.
Once the raw data transmission stage has been passed (see our previous article), we move on to the presentation of information and thus into the world of design. In other words, approval of use of the data product and its appropriateness for the consumer are put on an equal footing with the relevance of the data provided.
And as we will be making frequent reference to it, we will specify what we mean by Data Product.
Strictly speaking, it is the interface that will present the relevant business information for analysis or decision-making. The product presented to the “information consumer” will provide the latter with a business perspective, or business insight, based on use of the data.
In a broader sense, the data product is not only the interface but also the entire chain, whatever its length, of consecutive processing steps which transformed the raw data into information ready for “consumption”.
We will frequently refer to design based on the “B.I. user experience” or to UX Design (UX meaning User eXperience): adapting presentation to use while taking account of the profile of the person for whom the data product is intended.
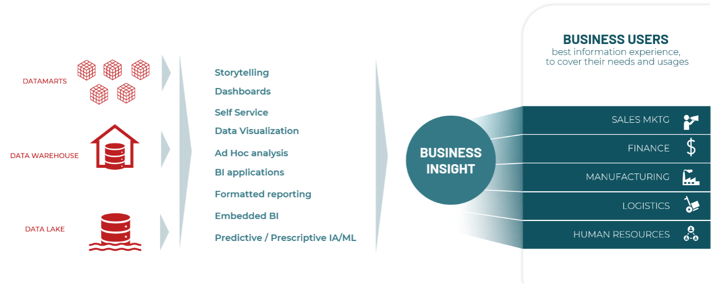
This diagram shows how the data product will be sourced from a data display model and which most suitable technical-functional channel we will choose to present this famous “business insight”.
Every term in this diagram has been chosen to allow us to dispense with the perceptions of all these methods of analysis and presentation that are often confused in the prevailing language of marketing.
We will explore this list from bottom to top, firstly in keeping with what requires most technical support, then moving on to the concepts in which end users must increase their independence from technical specialists.
We will use the English terms (as most literature on the subject is in English) and try to explain their meaning in French.
Predictive/Prescriptive AI/ML
This is the field of Data Science, in which the challenge is to find or develop algorithms that create new information based on the available data collected. The data must be of good quality and with a history to be able to predict relevant information.
Most importantly, Data Science enables us to acquire new information and ways of predicting future situations using data that is not necessarily structured and is increasingly “bulky”.
Data mining was the first step in data creation. From now on, Data Science allows to go even further. Thanks to its structured approach, Data Science allows an optimization of the business solutions developed thanks to an improvement of performance or determination and limitation of risks.
We need a precise functional objective for the approach and therefore not only the capacity for Python coding (which is the most popular language among data scientists). You need a perfect understanding of the problem and the business teams: translate the data into a solution and know how to restore the information to be used.
The 4 important skills :
• Business understanding
• Data Engener
• Data Science
• Business Analyst to render the information
It's when you put this quadruplet skills together around a business objective that we maximize the chances of success: swiftly describing the appropriateness and feasibility of the project, then finding an algorithmic solution and ensuring its relevance over time. We feel it is inappropriate here to single out Artificial Intelligence techniques including those of Machine Learning (ML or predicting through learning) or even AutoML (automated machine learning).
We can, however, specify that of all these channels, DataScience is undoubtedly the data transformation channel which uses all types of source formats, both internal and external, by freeing itself from models determined by IT; we can also specify that DataScience contributes to creating new information which we must choose either to store or present or integrate into business applications.
Embedded B.I.
Embedded B.I. is a method of enriching transactional applications by inserting analytical presentations to enable users to take an enlightened action (make a decision?) at the right time.
In the service sectors (banking, insurance, social, maintenance, etc.) these embedded B.I. are frequently offered to desk advisers as they provide them with comprehensive customer knowledge.
Software editors have become aware of the real needs of business functions, namely transforming their CRM (Customer Relationship Management) tool into a real flight deck for making decisions and taking action.
Their tools, which they used to call analytical CRM, now go a notch further and allow them to take account of data at an individual level. It is thus possible to inform the commercial work environment and help it, for example, to:
- Visualize the state of its prospecting or the level of its pipeline,
- Select its targets and thus determine the most effective next action on its agenda or in its round
- Understand the levers of its individual and collective performance
This is an illustration of the very operational nature of embedded B.I. in applications.
In logistical and manufacturing businesses, very operational workstations are documented in order to predict breakdowns or waste, monitor packaging or shipments, etc. in environments that are often not conducive to manipulating a B.I. solution on a laptop, but can use push/pull solutions for information that is appropriate to the context of use.
In a word, embedded B I. helps make it easier for the operator to see information that is not ordinarily visible. We refer to this as a form of “augmented reality”.
Formatted reporting
This refers to all the presentations which are created for a regular, repeated need and will avoid any discussion of their relevance and documentation.
Most of the time these reports and their method of publication are precisely specified and the data product is created by the IT team to ensure the integrity, effectiveness and security of the result.
The more the business interacts with IT throughout the product's development, the greater the certainty that the data product will be received with the highest level of UX relevance. Of course, this does not mean that these reports will not evolve over time. But we will then take the precaution of checking that their development meets the needs of all users listed and that the new version will benefit from the same guarantees of functional and technical validation as the previous version. This previous version will now become deliberately obsolete and will be withdrawn from the portfolio of data products. Formatted reporting is an element of the company’s strong B.I. heritage. It is in this form that all innovative work from businesses (self-service, office, even shadow-IT) should reach a successful conclusion in order to become communicable company truths.
Formatted reporting must be subject to frequent reviews (Business and IT) to ensure the continuity of its Service Quality (relevance, effectiveness, compliance, security, etc.).
B.I. applications
Generally speaking, these are data products which present “scripted” interfaces or even workflows and allow interaction with their users. It could therefore be said that B.I. applications are management apps that use dashboards and help us understand how indicators have evolved by presenting “cascading” points of view.
As with all applications, UX Design is important but browsing and explanatory routes are equally important.
Ad Hoc Analysis
Everything starts with a question that has never been asked by the company. An ad hoc analysis takes time: you must be rigorous and curious to understand the different correlations between data or facts. This is the promise of ad hoc analysis.
A promise which implies that users have direct access to data and presentations, from which they can construct or derive their own analysis in the context of the moment.
Ad Hoc Analysis is a means of reacting to urgent questions for which content is essential. Insights should be presented in a meaningful way to justify the importance of the discovery.
The BI. of the 1980s was designed to enable businesses to access data by means of “semantic layers” to name objects and assemble them in queries.
This enables us to obtain results that we can refine through successive iterations, both for content (filters, intersection of axes, fragmentation/regrouping, etc.) and for a presentation that is both fast and relevant (graphs, tables, bureaucratic mining, etc.).
Ad hoc analysis falls within the field of the working document and disposable exploration. When badly managed by its authors, not documented or taken out of context, ad hoc analysis can create clutter in work spaces and become dangerous if it is not controlled. But when worked on collaboratively with a business community, it can become the start of a lasting reporting system which will add value.
Data Visualization
“Dataviz” means ensuring that the choice of visual format for a data presentation becomes an item of information in its own right, immediately understandable and highlighting the key information that will encourage reflection or decision-making.
A choice of support grids is regularly published or passed on in order to classify visuals according to the desired objective: comparison, classification, seasonality, differences, progressions, etc. The very nature of a Data Visualization tool is to offer “naturally” visual representations that are most suited to the analysis taking place, according to the indicators and measurements being used. The time and geographical measurements become a prerequisite but the very nature of the analysis and the data dependency between them are increasingly taken into account, or even the analysis habits of the user (or of all users) that the software will have systematized by learning.
Dashboards
The principle of the dashboard system is to gather together all the vital information needed by the user at the key moment in the decision-making process.
The dashboard can take the form of a report with a layout adapted to each user or it can be used by several business areas within a company.
But the dashboard is increasingly tending to become a personal tool enabling each person to organize his or her “points of view” on useful information, by theme or by key moment. In this case, the IT team will obviously not develop all the individual dashboards but must enable each user to design his or her own dashboard, by grouping together common or specific visuals.
We then arrive at a self-service Dashboard functionality, which leads us on to the following topic!
Self Service B.I.
This refers to all the data solutions made available to users which give them independence on a day-to-day basis in accessing useful information at the right time.
The point of view of the data presented must therefore be familiar to users and as clear as possible. The integration and presentation software must also match their culture and workstation. In a word, the tool must be adapted to the user who must have a good understanding of it to ensure this independence. There is thus a real challenge in terms of cultural integration, training and support.
But self-service also covers the need to understand all the information media which allow independence and avoid the loss of time and quality. Independently having reports and analyses available so that they can be adapted to ad hoc needs is the level of self-service to which all companies should aspire. This avoids a proliferation of existing reports in a single context.
It is important, therefore, that a company’s B.I. content be organized in an understandable and documented way. Just as it is essential that any communication on B.I. assets is available by business area or user category. For this reason, creating business communities that are monitored and managed is crucial in ensuring that the B.I. heritage is known and understood.
Self-service fulfills its role if it allows the construction of analyses that can be added to existing analyses, whether for the needs of the author or with a view to dissemination on a wider scale throughout the company.
Self-service must therefore be supported by an understandable and documented organization of the company’s B.I. content. For this to happen, implementing self-service must go hand in hand with cultural integration and genuine empowerment among users who will then transform data into company information.
We now come to the subjects of data governance and retrieval which we addressed in an earlier chapter: wanting to establish self-service B.I. in a company often equates to setting up a system of governance with roles and processes that were previously lacking.
Story Telling
This is a way of leading your audience to an obvious conclusion at the end of a “story”, often illustrated by evolving KPIs (key performance indicators) over a chosen period. For example, revealing seasonal events or linking seemingly decorrelated indicators in order to understand their simultaneity or immediate causality.
Of course it is the DataVisualizaton techniques that create the visual impact of the exercise, but the choice of scenario and the relevance of sequences over time are the real asset of a successful Data Story.
Swedish professor Hans Rosling made storytelling very explicit by producing stories than can be told using data, such as understanding the emancipation of women over recent centuries or the vision of the contemporary story of life expectancy. His 2010 presentation on the BBC created an impact which editors then seized upon, bringing the concept to within companies in order to magnify the increased value of data. (https://www.youtube.com/watch?v=Z8t4k0Q8e8Y)
However, the technique is not often usable in companies on a daily basis. These scenarios are more frequently used by communication teams than in management or steering committees.
Both the common terms and what they cover are generally dismissed.
We are thus responsible for a heritage of various data products at any given time, and the problem then arises of systematically qualifying the value of shareable truth in each of these products.
We mentioned Data Governance for ensuring the quality and value of the data presented for use. We now need to confront another thorny issue for many organizations: Information Governance and in particular Retrieval Governance which more specifically concerns B.I. These are subjects which touch on ownership, accessibility, validation, dissemination and its security, versioning, communication, and so on.
We can illustrate the usefulness of Data Science through a real business case.
by Emma Damitio, Data Scientist Solution BI Canada
Our client, a foundation whose mission is to support young people in Quebec since 2009 via 3 channels (calls - chat - texting), is facing a double problem: a waiting time too long for young people in demand and not enough staff to respond to all interventions.
The shortage of manpower is a real problem, and the data science solution proposed here to alleviate both problems is to optimize the available resources as much as possible in order to place them at the best times.
In order to provide a concrete and sustainable optimization, our team of Data Scientists first explored our client's organizational patterns to understand them perfectly.
Once this first mandatory phase of understanding was achieved, we were able to develop a model predicting the number of contact requests per channel, per hour, for the next 3 months in order to place the necessary number of responders.
The combination of these two results allowed us to create a complete planning tool with two dashboards.
From now on, our client can anticipate :
• the number of interventions over the next 3 months, and how they are distributed
• the number of employees to be positioned according to the time slot over the next 3 months
• the need in human resources over the next 3 months
To date, the benefits are numerous:
• Increased service response rate: % decrease in contact request abandonment
• Reduced scheduling time and effort: 10 hours of time saved every 4 weeks
• Better visibility into resource needs: be able to support a hiring request backed by proof of need
Suggested reading :
Business Intelligence in 3 steps
Process Intelligence : understand how data flows
Data Intelligence : making data available